Search a school
2,913 Colleges

Miami, FL
•
Private--Acceptance rate
--Avg GPA
--Cost
900Undergrads

New York, NY
•
Private22%Acceptance rate
--Avg GPA
$59KCost
1KUndergrads


Harlem, MT
•
Public--Acceptance rate
--Avg GPA
--Cost
Fewer than 200Undergrads

Abilene, TX
•
Private70%Acceptance rate
--Avg GPA
$52KCost
3KUndergrads

Tifton, GA
•
Public76%Acceptance rate
--Avg GPA
$18KCost
4KUndergrads

Bloomington, MN
•
Private--Acceptance rate
--Avg GPA
--Cost
Fewer than 200Undergrads

San Francisco, CA
•
Private--Acceptance rate
--Avg GPA
$47KCost
5KUndergrads

Alamosa, CO
•
Public100%Acceptance rate
--Avg GPA
$31KCost
2KUndergrads
Garden City, NY
•
Private78%Acceptance rate
3.63Avg GPA
$62KCost
5KUndergrads
Type to search...
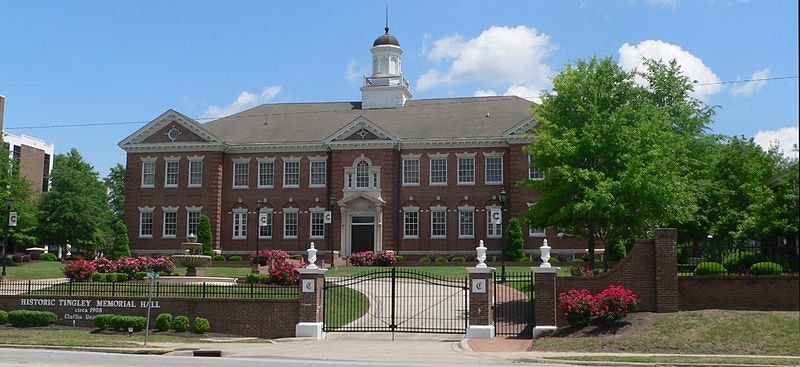
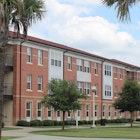
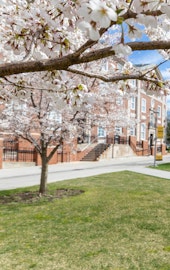
Claflin University
Orangeburg, South Carolina•Private
Your chances
—
Acceptance rate
62%
Private school in South Carolina with 1,700 total undergraduate students
Rural
Southeast
United Methodist
HBCU
Central Intercollegiate Athletic Association
400 Magnolia Street, Orangeburg, SC 29115
(803) 535-5000
Chancing
What are your chances of acceptance?
Your chances
100%
Admissions
Overall acceptance rate
62%
Yield rate - overall
6%
Acceptance rate breakdown
Women
61%
Men
63%
Applicant breakdown
Total number of applicants
8,467
Women: 59%
Men: 41%
Cost & scholarships
Your estimated net cost
$ ? / year
In-state
$26,526
Out-of-state
$26,526
Published costs and averages can be misleading: they don’t fully account for your family’s finances (for financial aid) or your academic profile (for scholarships).
Want to see your personalized net cost after financial aid and scholarships?
Applications
How to apply
Accepts Common App
Test required
Rec letters optional
Doesn’t consider class rank
TOEFL optional (international applicants)
Tests typically submitted
SAT: 52%
ACT: 48%
Policies can change. Please confirm by looking at this school’s website.
Students
First-year enrolled students (full-time)
315
Student diversity
Very diverse
4-year graduation rate
37%
6-year graduation rate
51%
Retention rate
76%
Admission policy
Co-ed
International students
1%
Enrolled breakdown by gender
Women: 69%
Men: 31%
Race & ethnicity diversity
Among domestic studentsAsian and Pacific Islander
1%
Black
93%
Hispanic
2%
Native American
2%
Other
1%
White
2%
Academics
Student faculty ratio
14:1
Calendar system
Semester
Special academic offering
Offers graduate degree
Where does this data come from?