Search a school
2,913 Colleges

Miami, FL
•
Private--Acceptance rate
--Avg GPA
--Cost
900Undergrads

New York, NY
•
Private22%Acceptance rate
--Avg GPA
$59KCost
1KUndergrads


Harlem, MT
•
Public--Acceptance rate
--Avg GPA
--Cost
Fewer than 200Undergrads
Abilene, TX
•
Private70%Acceptance rate
--Avg GPA
$52KCost
3KUndergrads

Tifton, GA
•
Public76%Acceptance rate
--Avg GPA
$18KCost
4KUndergrads

Bloomington, MN
•
Private--Acceptance rate
--Avg GPA
--Cost
Fewer than 200Undergrads

San Francisco, CA
•
Private--Acceptance rate
--Avg GPA
$47KCost
5KUndergrads

Alamosa, CO
•
Public100%Acceptance rate
--Avg GPA
$31KCost
2KUndergrads
Garden City, NY
•
Private78%Acceptance rate
3.63Avg GPA
$62KCost
5KUndergrads
Type to search...
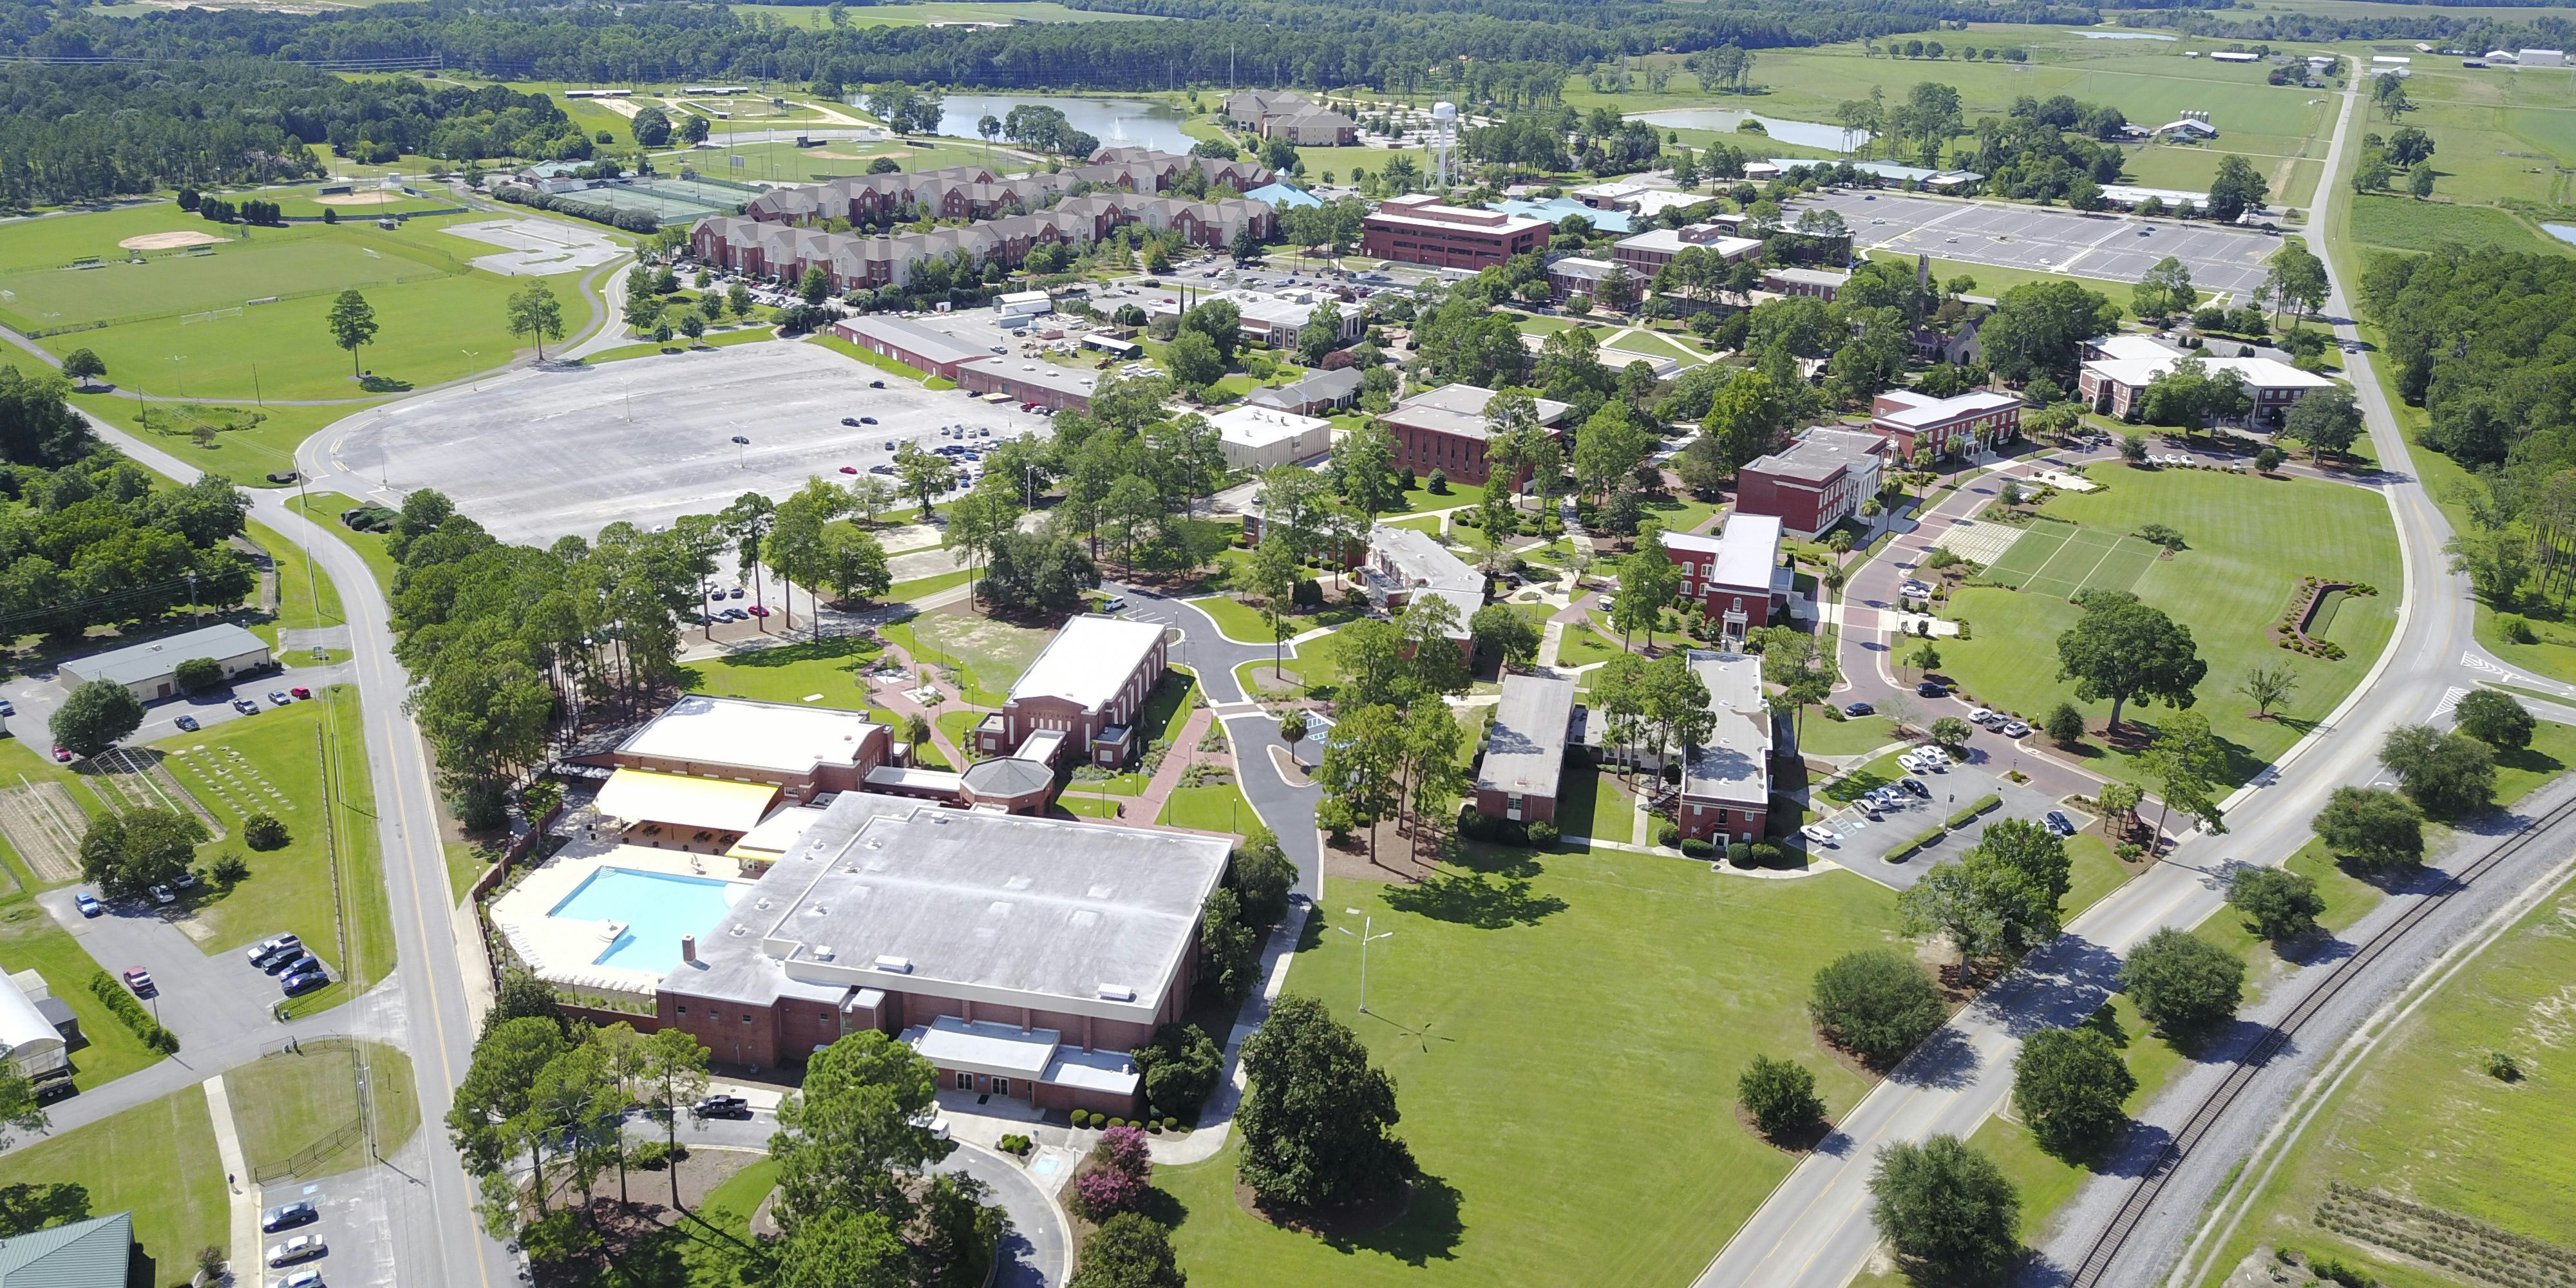
Abraham Baldwin Agricultural College
Tifton, Georgia•Public
Your chances
—
Acceptance rate
76%
Public school in Georgia with 3,600 total undergraduate students
Rural
Southeast
2802 Moore Hwy, Tifton, GA 31793
(229) 391-5001
Chancing
What are your chances of acceptance?
Your chances
98%
Admissions
Overall acceptance rate
76%
Yield rate - overall
52%
Acceptance rate breakdown
Women
73%
Men
78%
Applicant breakdown
Total number of applicants
2,190
Women: 61%
Men: 39%
Cost & scholarships
Your estimated net cost
$ ? / year
In-state
$11,395
Out-of-state
$18,301
Average net cost after aid
Income
Average net cost
$0–30,000
$5,141
$30,001–48,000
$5,474
$48,001–75,000
$7,913
$75,001–110,000
$10,569
Over $110,000
$10,636
Published costs and averages can be misleading: they don’t fully account for your family’s finances (for financial aid) or your academic profile (for scholarships).
Want to see your personalized net cost after financial aid and scholarships?
Applications
How to apply
Doesn’t accept Common App
Test optional
Rec letters not used
Doesn’t consider class rank
TOEFL required (international applicants)
Tests typically submitted
SAT: 15%
ACT: 12%
Policies can change. Please confirm by looking at this school’s website.
Students
First-year enrolled students (full-time)
865
Student diversity
Low diversity
4-year graduation rate
16%
6-year graduation rate
24%
Retention rate
64%
Admission policy
Co-ed
International students
1%
Enrolled breakdown by gender
Women: 56%
Men: 44%
Race & ethnicity diversity
Among domestic studentsAsian and Pacific Islander
1%
Black
21%
Hispanic
5%
Native American
< 1%
Other
1%
White
71%
Academics
Student faculty ratio
18:1
Calendar system
Semester
Special academic offering
Where does this data come from?