Search a school
1 College
Babson Park, MA
•
Private25%Acceptance rate
3.86Avg GPA
$74KCost
3KUndergrads
Type to search
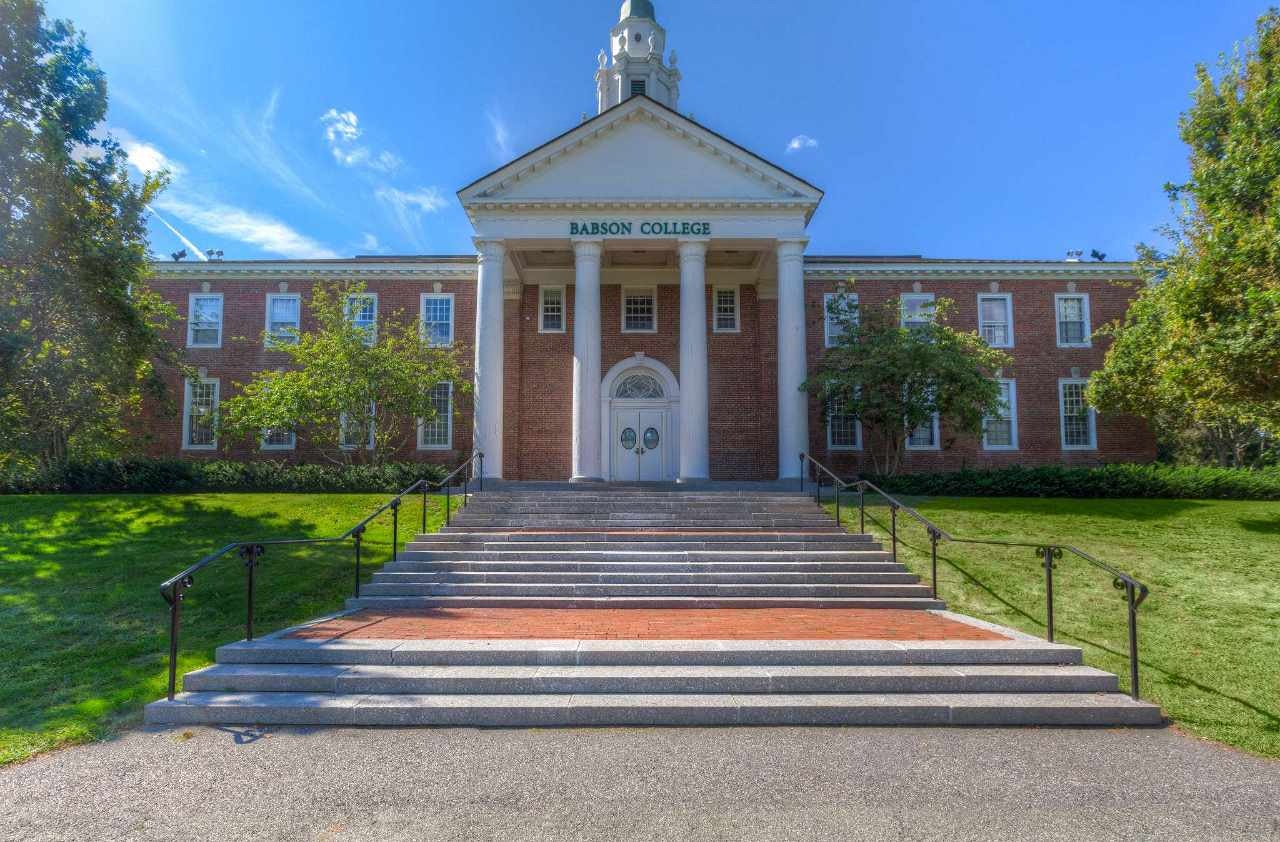
Babson College
Babson Park, Massachusetts•Private
Your chances
—
Acceptance rate
25%
Private school in Massachusetts with 2,500 total undergraduate students
Suburban
New England
Special focus: Business
New England Women's & Men's Athletic Conference
231 Forest Street, Babson Park, MA 02457
(781) 235-1200
Loading…
Admissions
Overall acceptance rate
25%
Yield rate - overall
36%
Acceptance rate breakdown
Women
36%
Men
19%
Applicant breakdown
Total number of applicants
7,104
Women: 34%
Men: 66%
Cost & scholarships
Your estimated net cost
$ ? / year
In-state
$73,972
Out-of-state
$73,972
Published costs and averages can be misleading: they don’t fully account for your family’s finances (for financial aid) or your academic profile (for scholarships).
Want to see your personalized net cost after financial aid and scholarships?
Applications
How to apply
Accepts Common App
Test optional
Rec letters optional
Considers class rank
TOEFL required (international applicants)
Tests typically submitted
SAT: 34%
ACT: 14%
Policies can change. Please confirm by looking at this school’s website.
Students
First-year enrolled students (full-time)
650
Student diversity
Diverse
4-year graduation rate
92%
6-year graduation rate
95%
Retention rate
95%
Admission policy
Co-ed
International students
31%
Enrolled breakdown by gender
Women: 46%
Men: 54%
Race & ethnicity diversity
Among domestic studentsAsian and Pacific Islander
16%
Black
6%
Hispanic
14%
Native American
< 1%
Other
14%
White
49%
Academics
Student faculty ratio
14:1
Calendar system
Semester
Special academic offering
Study abroad
Offers graduate degree
Where does this data come from?