Search a school
1 College
North Newton, KS
•
Private71%Acceptance rate
--Avg GPA
$45KCost
500Undergrads
Type to search
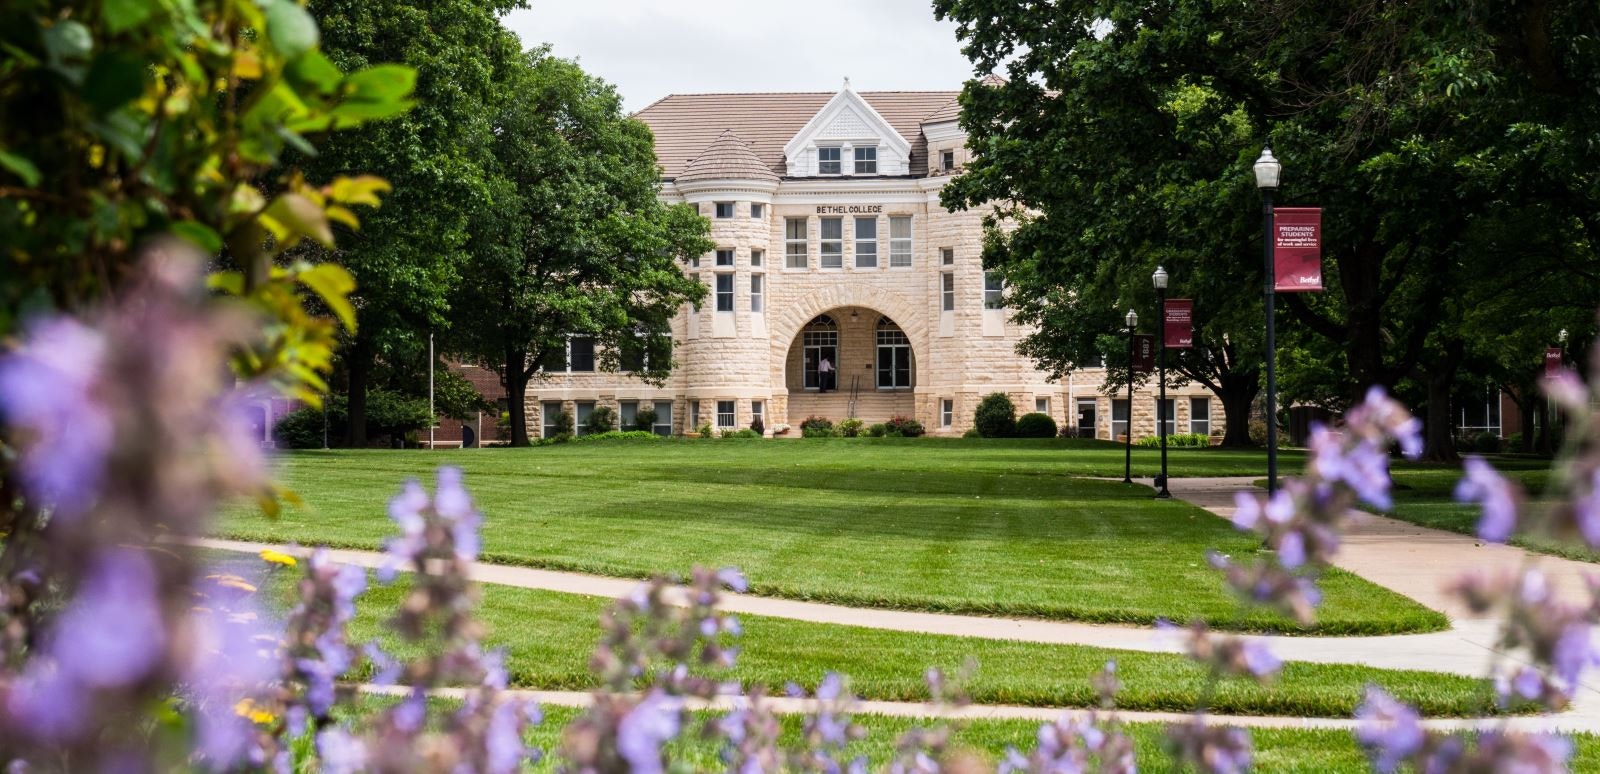
Bethel College
North Newton, Kansas•Private
Your chances
—
Acceptance rate
71%
Private school in Kansas with 500 total undergraduate students
Rural
Plains
Other (none of the above)
Kansas Collegiate Athletic Conference
300 E 27th St, North Newton, KS 67117
(316) 283-2500
Loading…
Admissions
Overall acceptance rate
71%
Yield rate - overall
26%
Acceptance rate breakdown
Women
71%
Men
70%
Applicant breakdown
Total number of applicants
830
Women: 44%
Men: 56%
Cost & scholarships
Your estimated net cost
$ ? / year
In-state
$44,920
Out-of-state
$44,920
Published costs and averages can be misleading: they don’t fully account for your family’s finances (for financial aid) or your academic profile (for scholarships).
Want to see your personalized net cost after financial aid and scholarships?
Applications
How to apply
Doesn’t accept Common App
Test optional
Rec letters optional
Doesn’t consider class rank
TOEFL required (international applicants)
Tests typically submitted
SAT: 13%
ACT: 65%
Policies can change. Please confirm by looking at this school’s website.
Students
First-year enrolled students (full-time)
111
Student diversity
Low diversity
4-year graduation rate
30%
6-year graduation rate
44%
Retention rate
56%
Admission policy
Co-ed
International students
1%
Enrolled breakdown by gender
Women: 42%
Men: 58%
Race & ethnicity diversity
Among domestic studentsAsian and Pacific Islander
2%
Black
16%
Hispanic
9%
Native American
< 1%
Other
4%
White
68%
Academics
Student faculty ratio
11:1
Calendar system
Semester
Special academic offering
Study abroad
Credit for AP and IB exams
Academic and career counseling
Where does this data come from?