Search a school
1 College

Brunswick, GA
•
Public97%Acceptance rate
--Avg GPA
$21KCost
3KUndergrads
Type to search
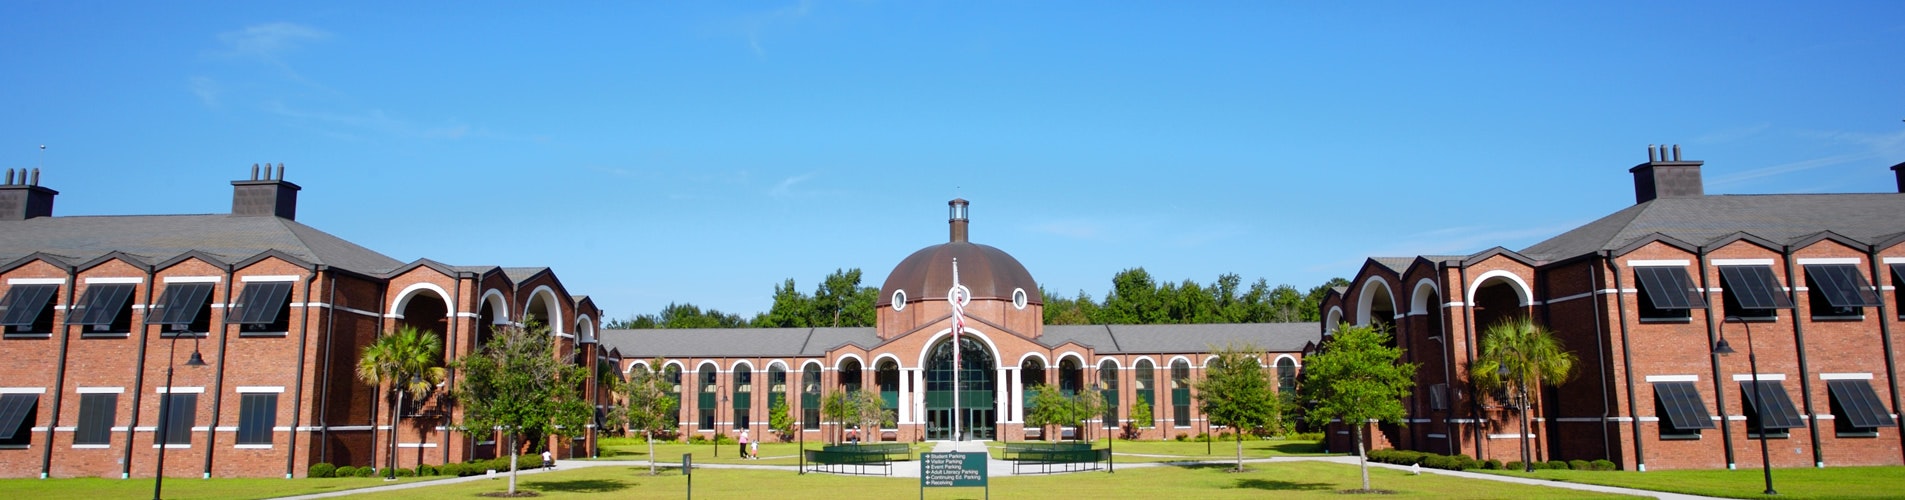
College of Coastal Georgia
Brunswick, Georgia•Public
Your chances
—
Acceptance rate
97%
Public school in Georgia with 3,100 total undergraduate students
Urban
Southeast
Commuter college
Florida Sun Conference
One College Drive, Brunswick, GA 31520
(912) 279-5700
Loading…
Admissions
Overall acceptance rate
97%
Yield rate - overall
29%
Acceptance rate breakdown
Women
97%
Men
96%
Applicant breakdown
Total number of applicants
2,078
Women: 70%
Men: 30%
Cost & scholarships
Your estimated net cost
$ ? / year
In-state
$14,413
Out-of-state
$21,319
Average net cost after aid
Income
Average net cost
$0–30,000
$10,612
$30,001–48,000
$10,536
$48,001–75,000
$13,571
$75,001–110,000
$16,513
Over $110,000
$16,496
Published costs and averages can be misleading: they don’t fully account for your family’s finances (for financial aid) or your academic profile (for scholarships).
Want to see your personalized net cost after financial aid and scholarships?
Applications
How to apply
Doesn’t accept Common App
Test optional
Rec letters not used
Doesn’t consider class rank
TOEFL required (international applicants)
Tests typically submitted
SAT: 9%
ACT: 9%
Policies can change. Please confirm by looking at this school’s website.
Students
First-year enrolled students (full-time)
584
Student diversity
Low diversity
4-year graduation rate
13%
6-year graduation rate
27%
Retention rate
59%
Admission policy
Co-ed
International students
1%
Enrolled breakdown by gender
Women: 66%
Men: 34%
Race & ethnicity diversity
Among domestic studentsAsian and Pacific Islander
2%
Black
19%
Hispanic
6%
Native American
< 1%
Other
6%
White
66%
Academics
Student faculty ratio
19:1
Calendar system
Semester
Special academic offering
Where does this data come from?