Search a school
1 College
Hanover, NH
•
Private6%Acceptance rate
3.90Avg GPA
$81KCost
4KUndergrads
Type to search
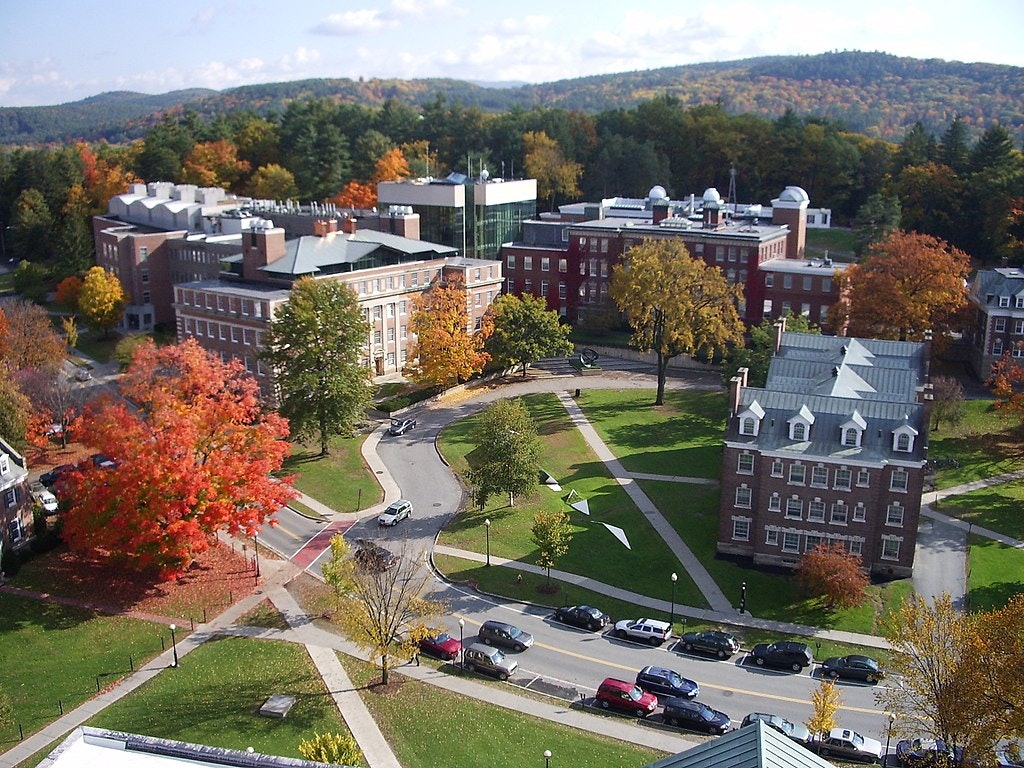
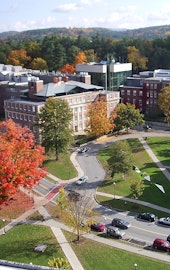
Dartmouth College
Hanover, New Hampshire•Private
Your chances
—
Acceptance rate
6%
Private school in New Hampshire with 4,400 total undergraduate students
Rural
New England
Medical school
D1 Basketball
Ivy Group
207 Parkhurst Hall, Hanover, NH 03755
(603) 646-1110
Loading…
Admissions
Overall acceptance rate
6%
Yield rate - overall
70%
Acceptance rate breakdown
Women
5%
Men
6%
Applicant breakdown
Total number of applicants
28,356
Women: 53%
Men: 47%
Cost & scholarships
Your estimated net cost
$ ? / year
In-state
$80,757
Out-of-state
$80,757
Published costs and averages can be misleading: they don’t fully account for your family’s finances (for financial aid) or your academic profile (for scholarships).
Want to see your personalized net cost after financial aid and scholarships?
Applications
How to apply
Accepts Common App
Test optional
Rec letters optional
Considers class rank
TOEFL required (international applicants)
Tests typically submitted
SAT: 47%
ACT: 30%
Policies can change. Please confirm by looking at this school’s website.
Students
First-year enrolled students (full-time)
1,124
Student diversity
Moderately diverse
4-year graduation rate
88%
6-year graduation rate
95%
Retention rate
97%
Admission policy
Co-ed
International students
9%
Enrolled breakdown by gender
Women: 51%
Men: 49%
Race & ethnicity diversity
Among domestic studentsAsian and Pacific Islander
17%
Black
7%
Hispanic
11%
Native American
2%
Other
9%
White
55%
Academics
Student faculty ratio
7:1
Calendar system
Quarter
Special academic offering
Offers graduate degree
Where does this data come from?