Search a school
1 College
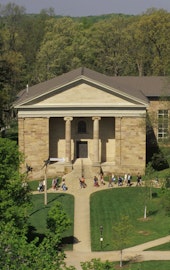
Gambier, OH
•
Private37%Acceptance rate
3.82Avg GPA
$80KCost
2KUndergrads
Type to search
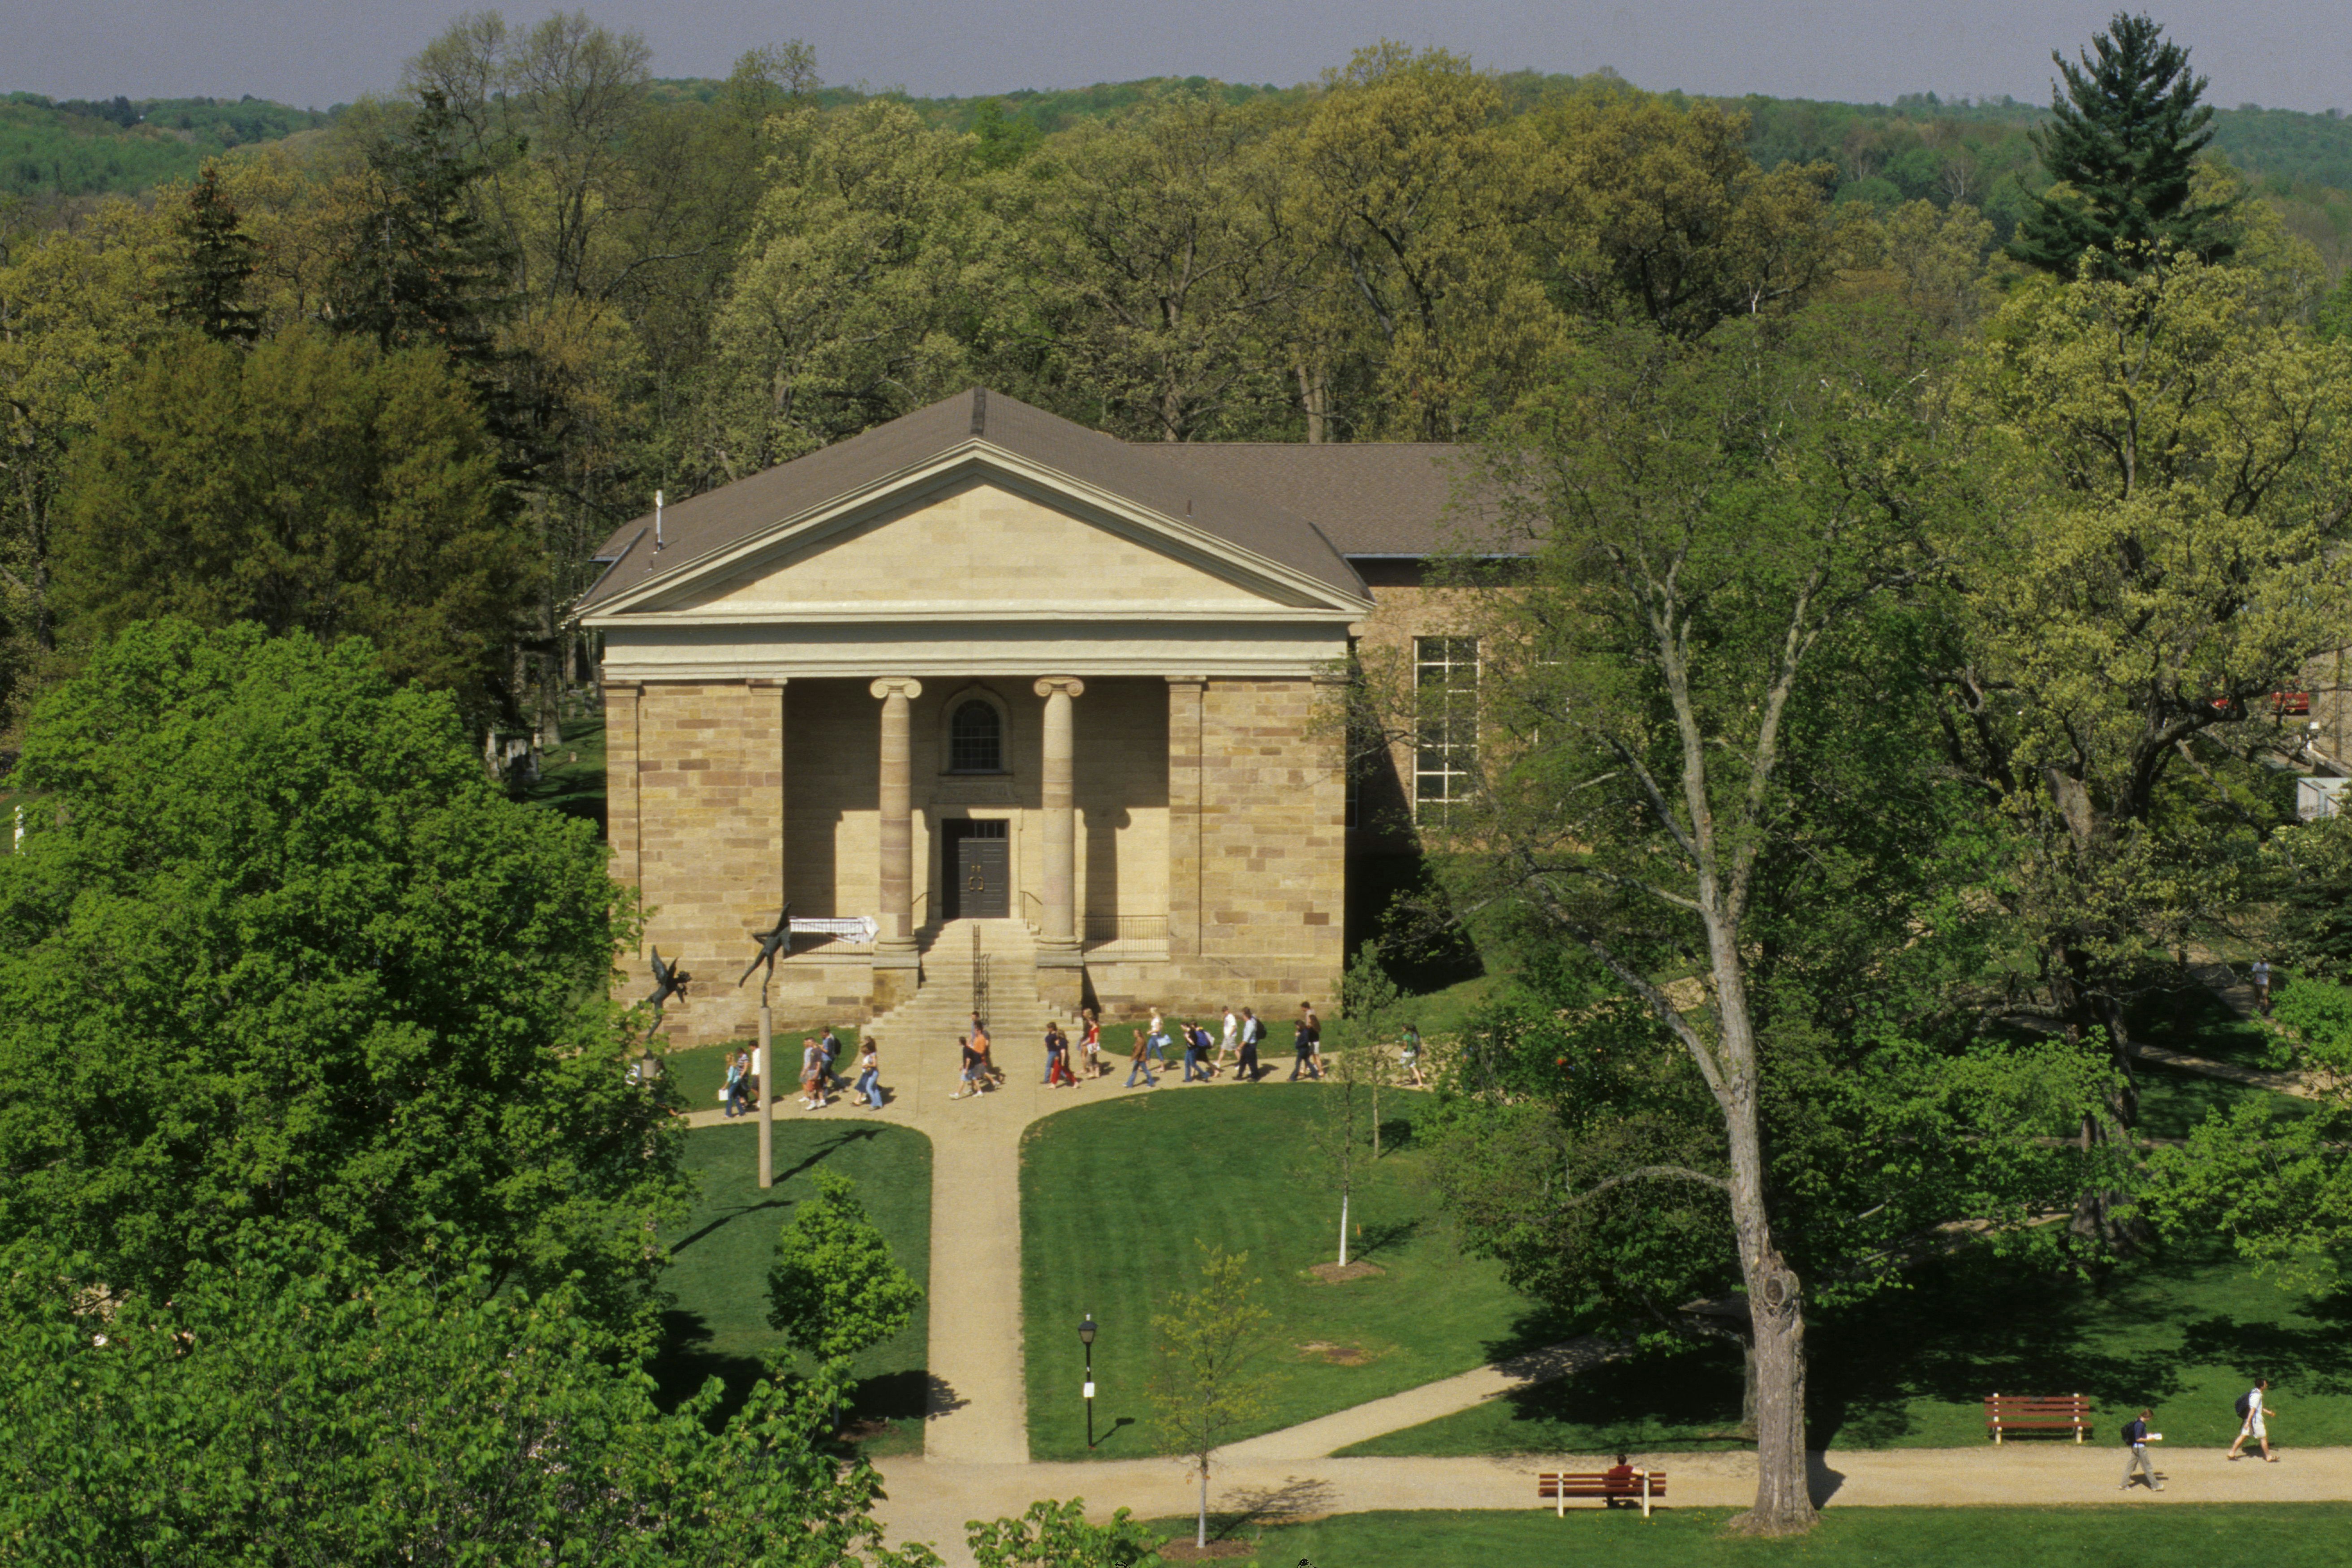
Kenyon College
Gambier, Ohio•Private
Your chances
—
Acceptance rate
37%
Private school in Ohio with 1,800 total undergraduate students
Rural
Great Lakes
North Coast Athletic Conference
Kenyon College, Gambier, OH 43022
(740) 427-5000
Loading…
Admissions
Overall acceptance rate
37%
Yield rate - overall
18%
Acceptance rate breakdown
Women
41%
Men
31%
Applicant breakdown
Total number of applicants
7,601
Women: 55%
Men: 45%
Cost & scholarships
Your estimated net cost
$ ? / year
In-state
$80,100
Out-of-state
$80,100
Published costs and averages can be misleading: they don’t fully account for your family’s finances (for financial aid) or your academic profile (for scholarships).
Want to see your personalized net cost after financial aid and scholarships?
Applications
How to apply
Accepts Common App
Test optional
Rec letters optional
Considers class rank
TOEFL optional (international applicants)
Tests typically submitted
SAT: 25%
ACT: 28%
Policies can change. Please confirm by looking at this school’s website.
Students
First-year enrolled students (full-time)
531
Student diversity
Low diversity
4-year graduation rate
86%
6-year graduation rate
89%
Retention rate
88%
Admission policy
Co-ed
International students
6%
Enrolled breakdown by gender
Women: 57%
Men: 43%
Race & ethnicity diversity
Among domestic studentsAsian and Pacific Islander
4%
Black
4%
Hispanic
8%
Native American
< 1%
Other
9%
White
76%
Academics
Student faculty ratio
10:1
Calendar system
Semester
Special academic offering
Where does this data come from?