Search a school
1 College
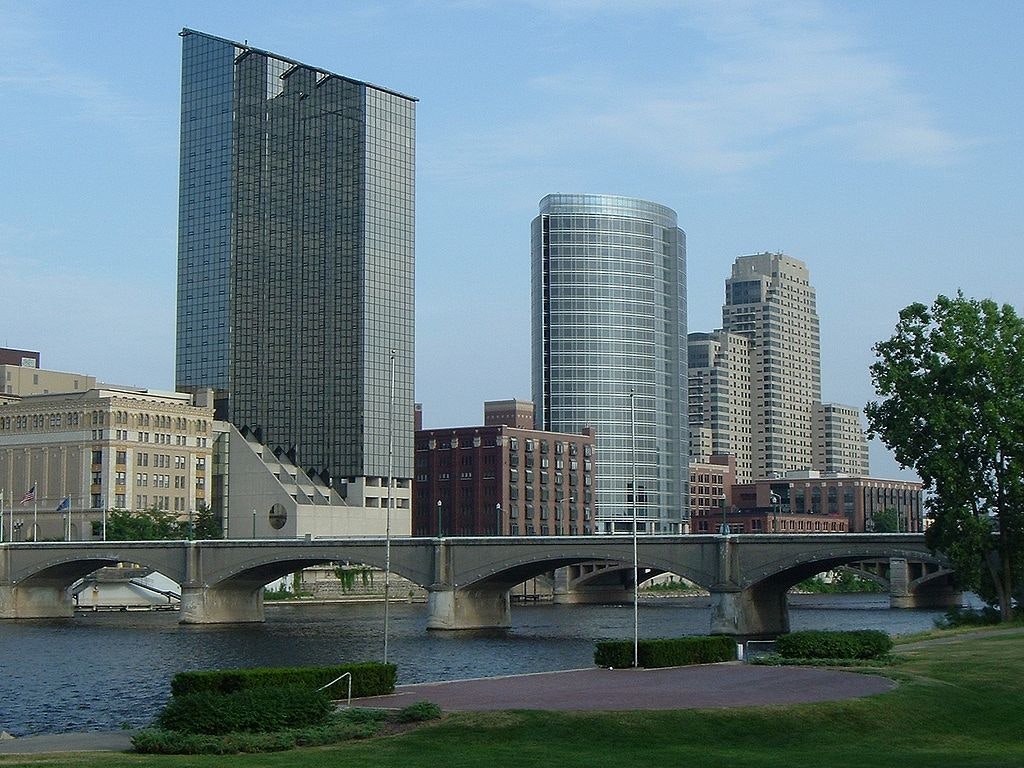
Grand Rapids, MI
•
Private69%Acceptance rate
--Avg GPA
$34KCost
Fewer than 200Undergrads
Type to search
Kuyper College
Grand Rapids, Michigan•Private
Your chances
—
Acceptance rate
69%
Private school in Michigan with fewer than 200 total undergraduate students
Suburban
Great Lakes
Other Protestant
3333 East Beltline Ave NE, Grand Rapids, MI 49525
(616) 222-3000
Loading…
Admissions
Overall acceptance rate
69%
Yield rate - overall
23%
Acceptance rate breakdown
Women
62%
Men
81%
Applicant breakdown
Total number of applicants
106
Women: 65%
Men: 35%
Cost & scholarships
Your estimated net cost
$ ? / year
In-state
$34,360
Out-of-state
$34,360
Published costs and averages can be misleading: they don’t fully account for your family’s finances (for financial aid) or your academic profile (for scholarships).
Want to see your personalized net cost after financial aid and scholarships?
Applications
How to apply
Doesn’t accept Common App
Test required
Rec letters not used
Considers class rank
TOEFL required (international applicants)
Tests typically submitted
SAT: 0%
ACT: 0%
Policies can change. Please confirm by looking at this school’s website.
Students
First-year enrolled students (full-time)
17
Student diversity
Very low diversity
4-year graduation rate
36%
6-year graduation rate
45%
Retention rate
75%
Admission policy
Co-ed
International students
4%
Enrolled breakdown by gender
Women: 35%
Men: 65%
Race & ethnicity diversity
Among domestic studentsAsian and Pacific Islander
3%
Black
2%
Hispanic
3%
Native American
1%
Other
8%
White
84%
Academics
Student faculty ratio
11:1
Calendar system
Semester
Special academic offering
Offers graduate degree
Where does this data come from?