Search a school
1 College
Tuscaloosa, AL
•
Private76%Acceptance rate
--Avg GPA
$21KCost
700Undergrads
Type to search
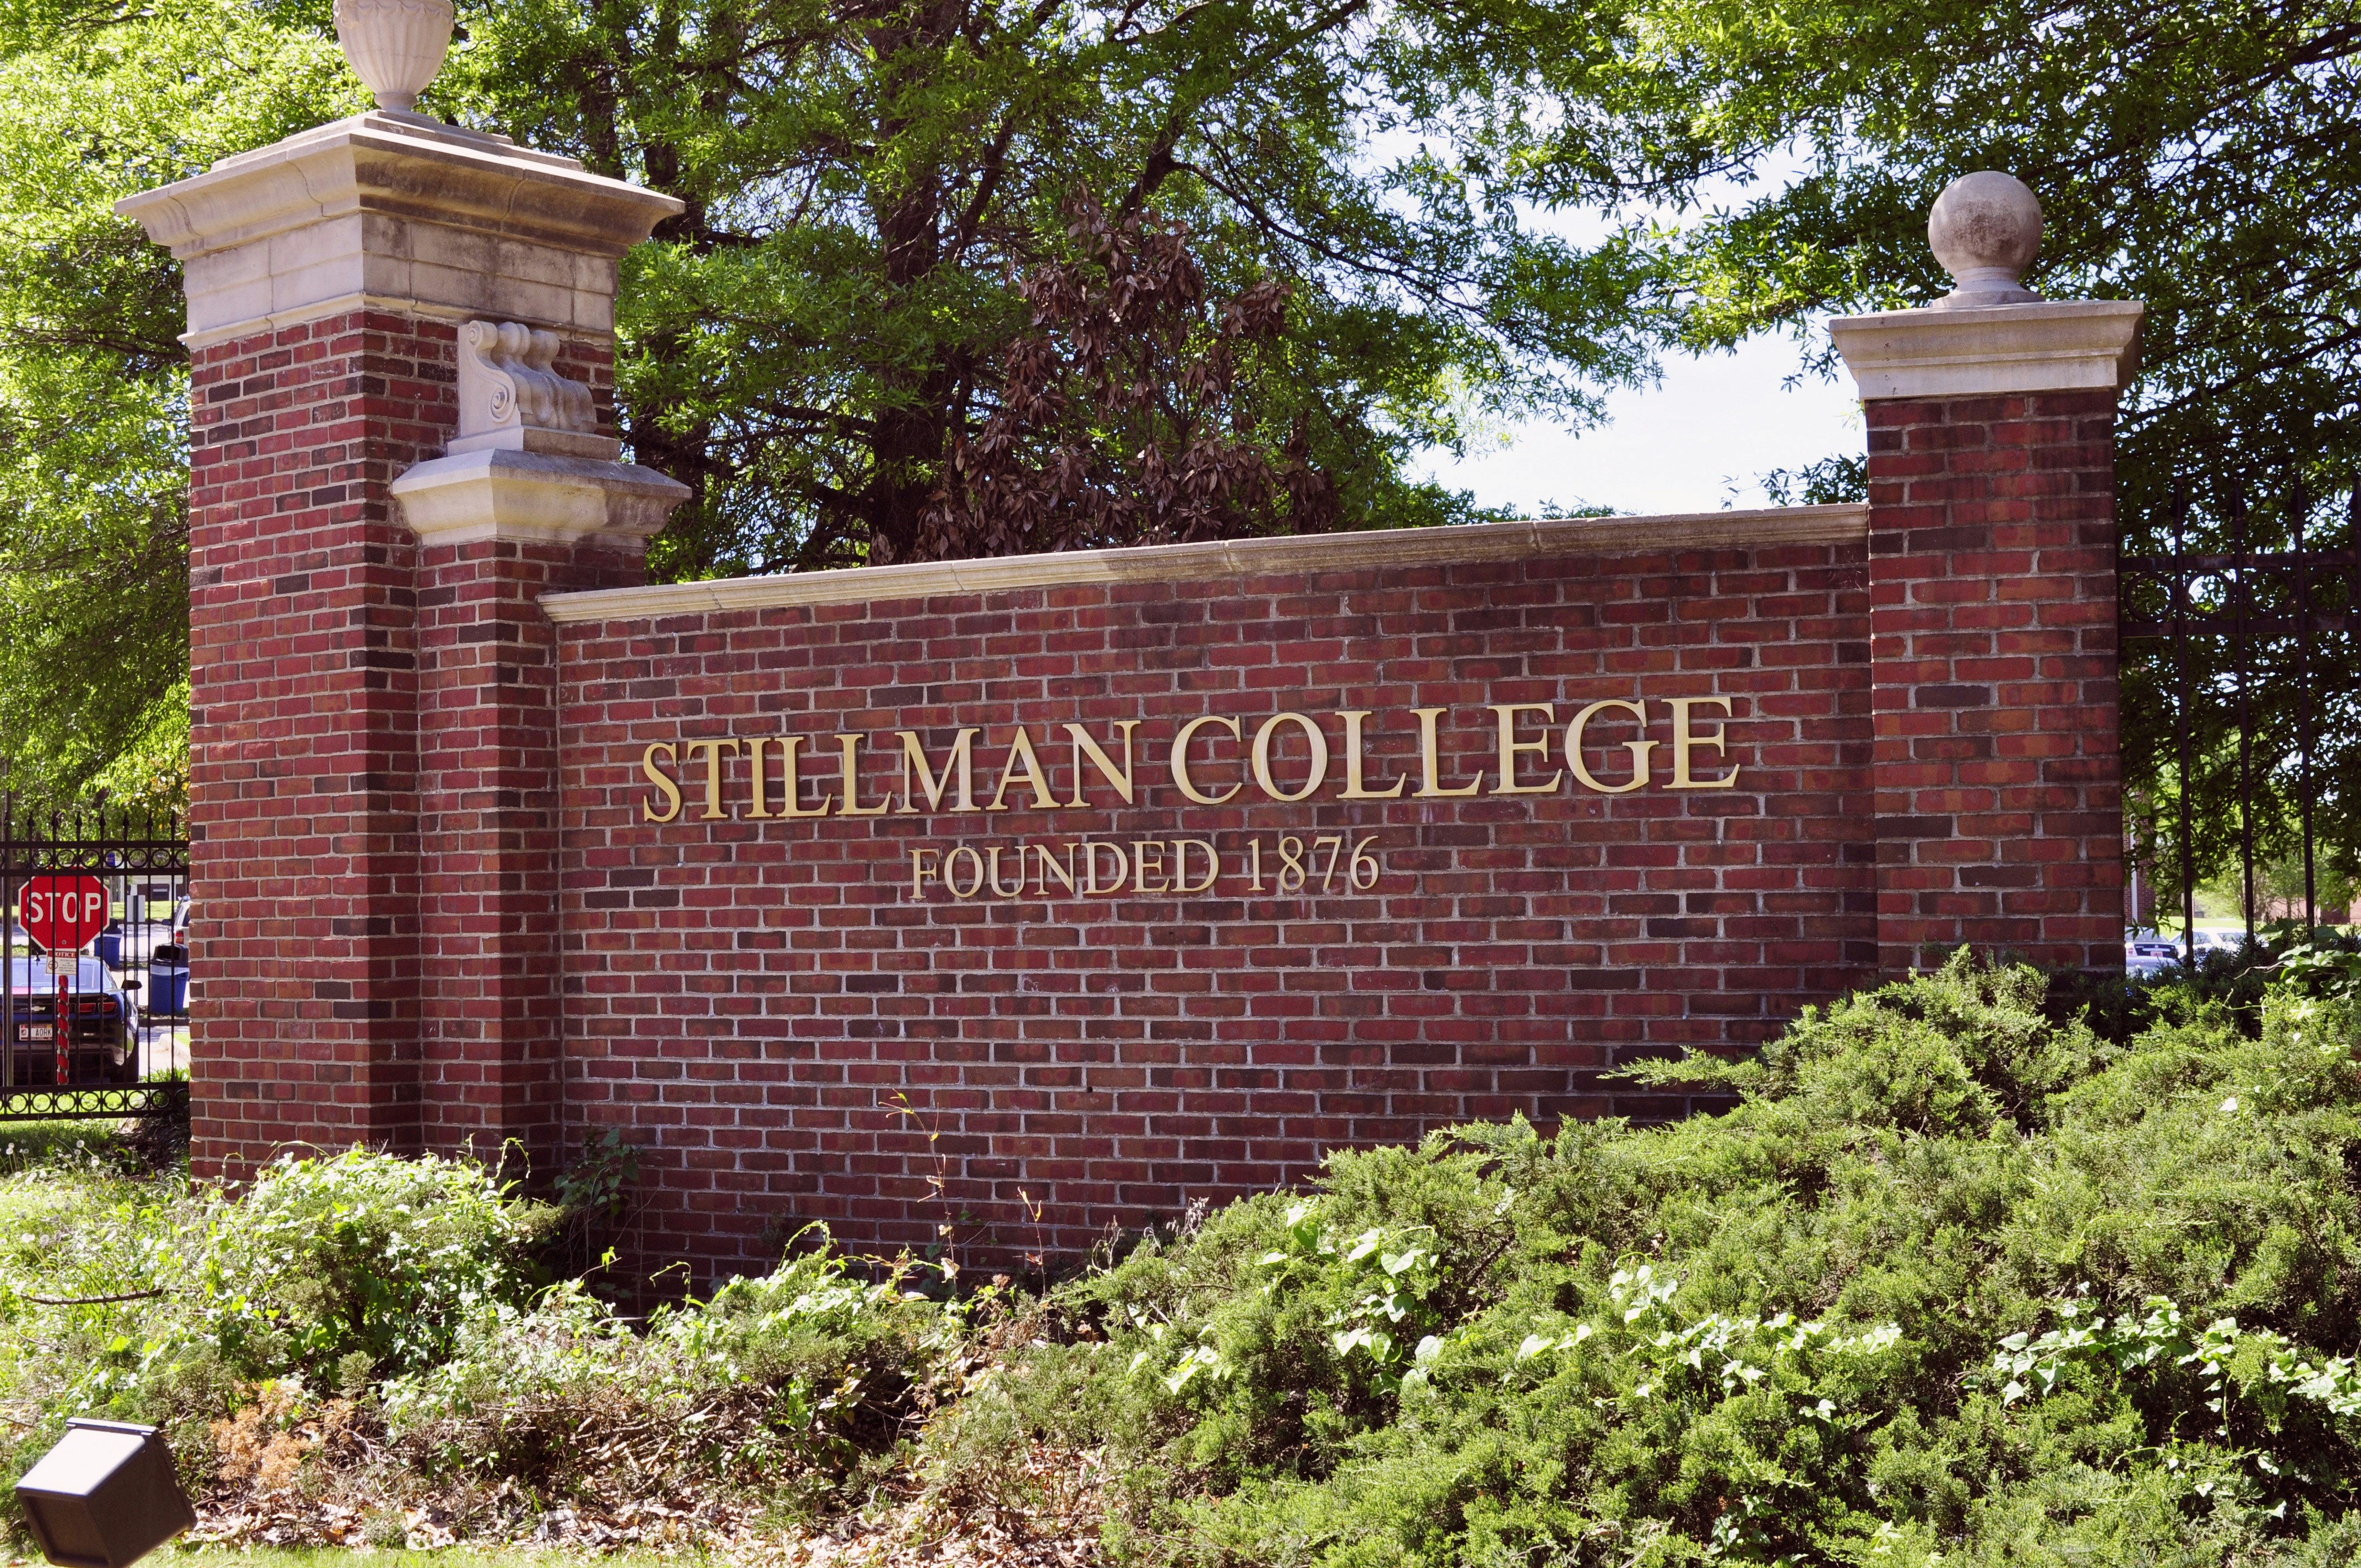
Stillman College
Tuscaloosa, Alabama•Private
Your chances
—
Acceptance rate
76%
Private school in Alabama with 700 total undergraduate students
Urban
Southeast
Presbyterian Church (USA)
HBCU
Southern States Athletic Conference
3601 Stillman Boulevard, Tuscaloosa, AL 35401
(205) 349-4240
Loading…
Admissions
Overall acceptance rate
76%
Yield rate - overall
15%
Acceptance rate breakdown
Women
74%
Men
77%
Applicant breakdown
Total number of applicants
1,189
Women: 65%
Men: 35%
Cost & scholarships
Your estimated net cost
$ ? / year
In-state
$21,446
Out-of-state
$21,446
Published costs and averages can be misleading: they don’t fully account for your family’s finances (for financial aid) or your academic profile (for scholarships).
Want to see your personalized net cost after financial aid and scholarships?
Applications
How to apply
Doesn’t accept Common App
Test optional
Rec letters not used
Doesn’t consider class rank
TOEFL required (international applicants)
Policies can change. Please confirm by looking at this school’s website.
Students
First-year enrolled students (full-time)
134
Student diversity
Very diverse
4-year graduation rate
10%
6-year graduation rate
27%
Retention rate
68%
Admission policy
Co-ed
International students
0%
Enrolled breakdown by gender
Women: 56%
Men: 44%
Race & ethnicity diversity
Among domestic studentsAsian and Pacific Islander
< 1%
Black
82%
Hispanic
2%
Native American
< 1%
Other
9%
White
6%
Academics
Student faculty ratio
15:1
Calendar system
Semester
Special academic offering
Where does this data come from?