Search a school
1 College
Barbourville, KY
•
Private56%Acceptance rate
3.25Avg GPA
$38KCost
800Undergrads
Type to search
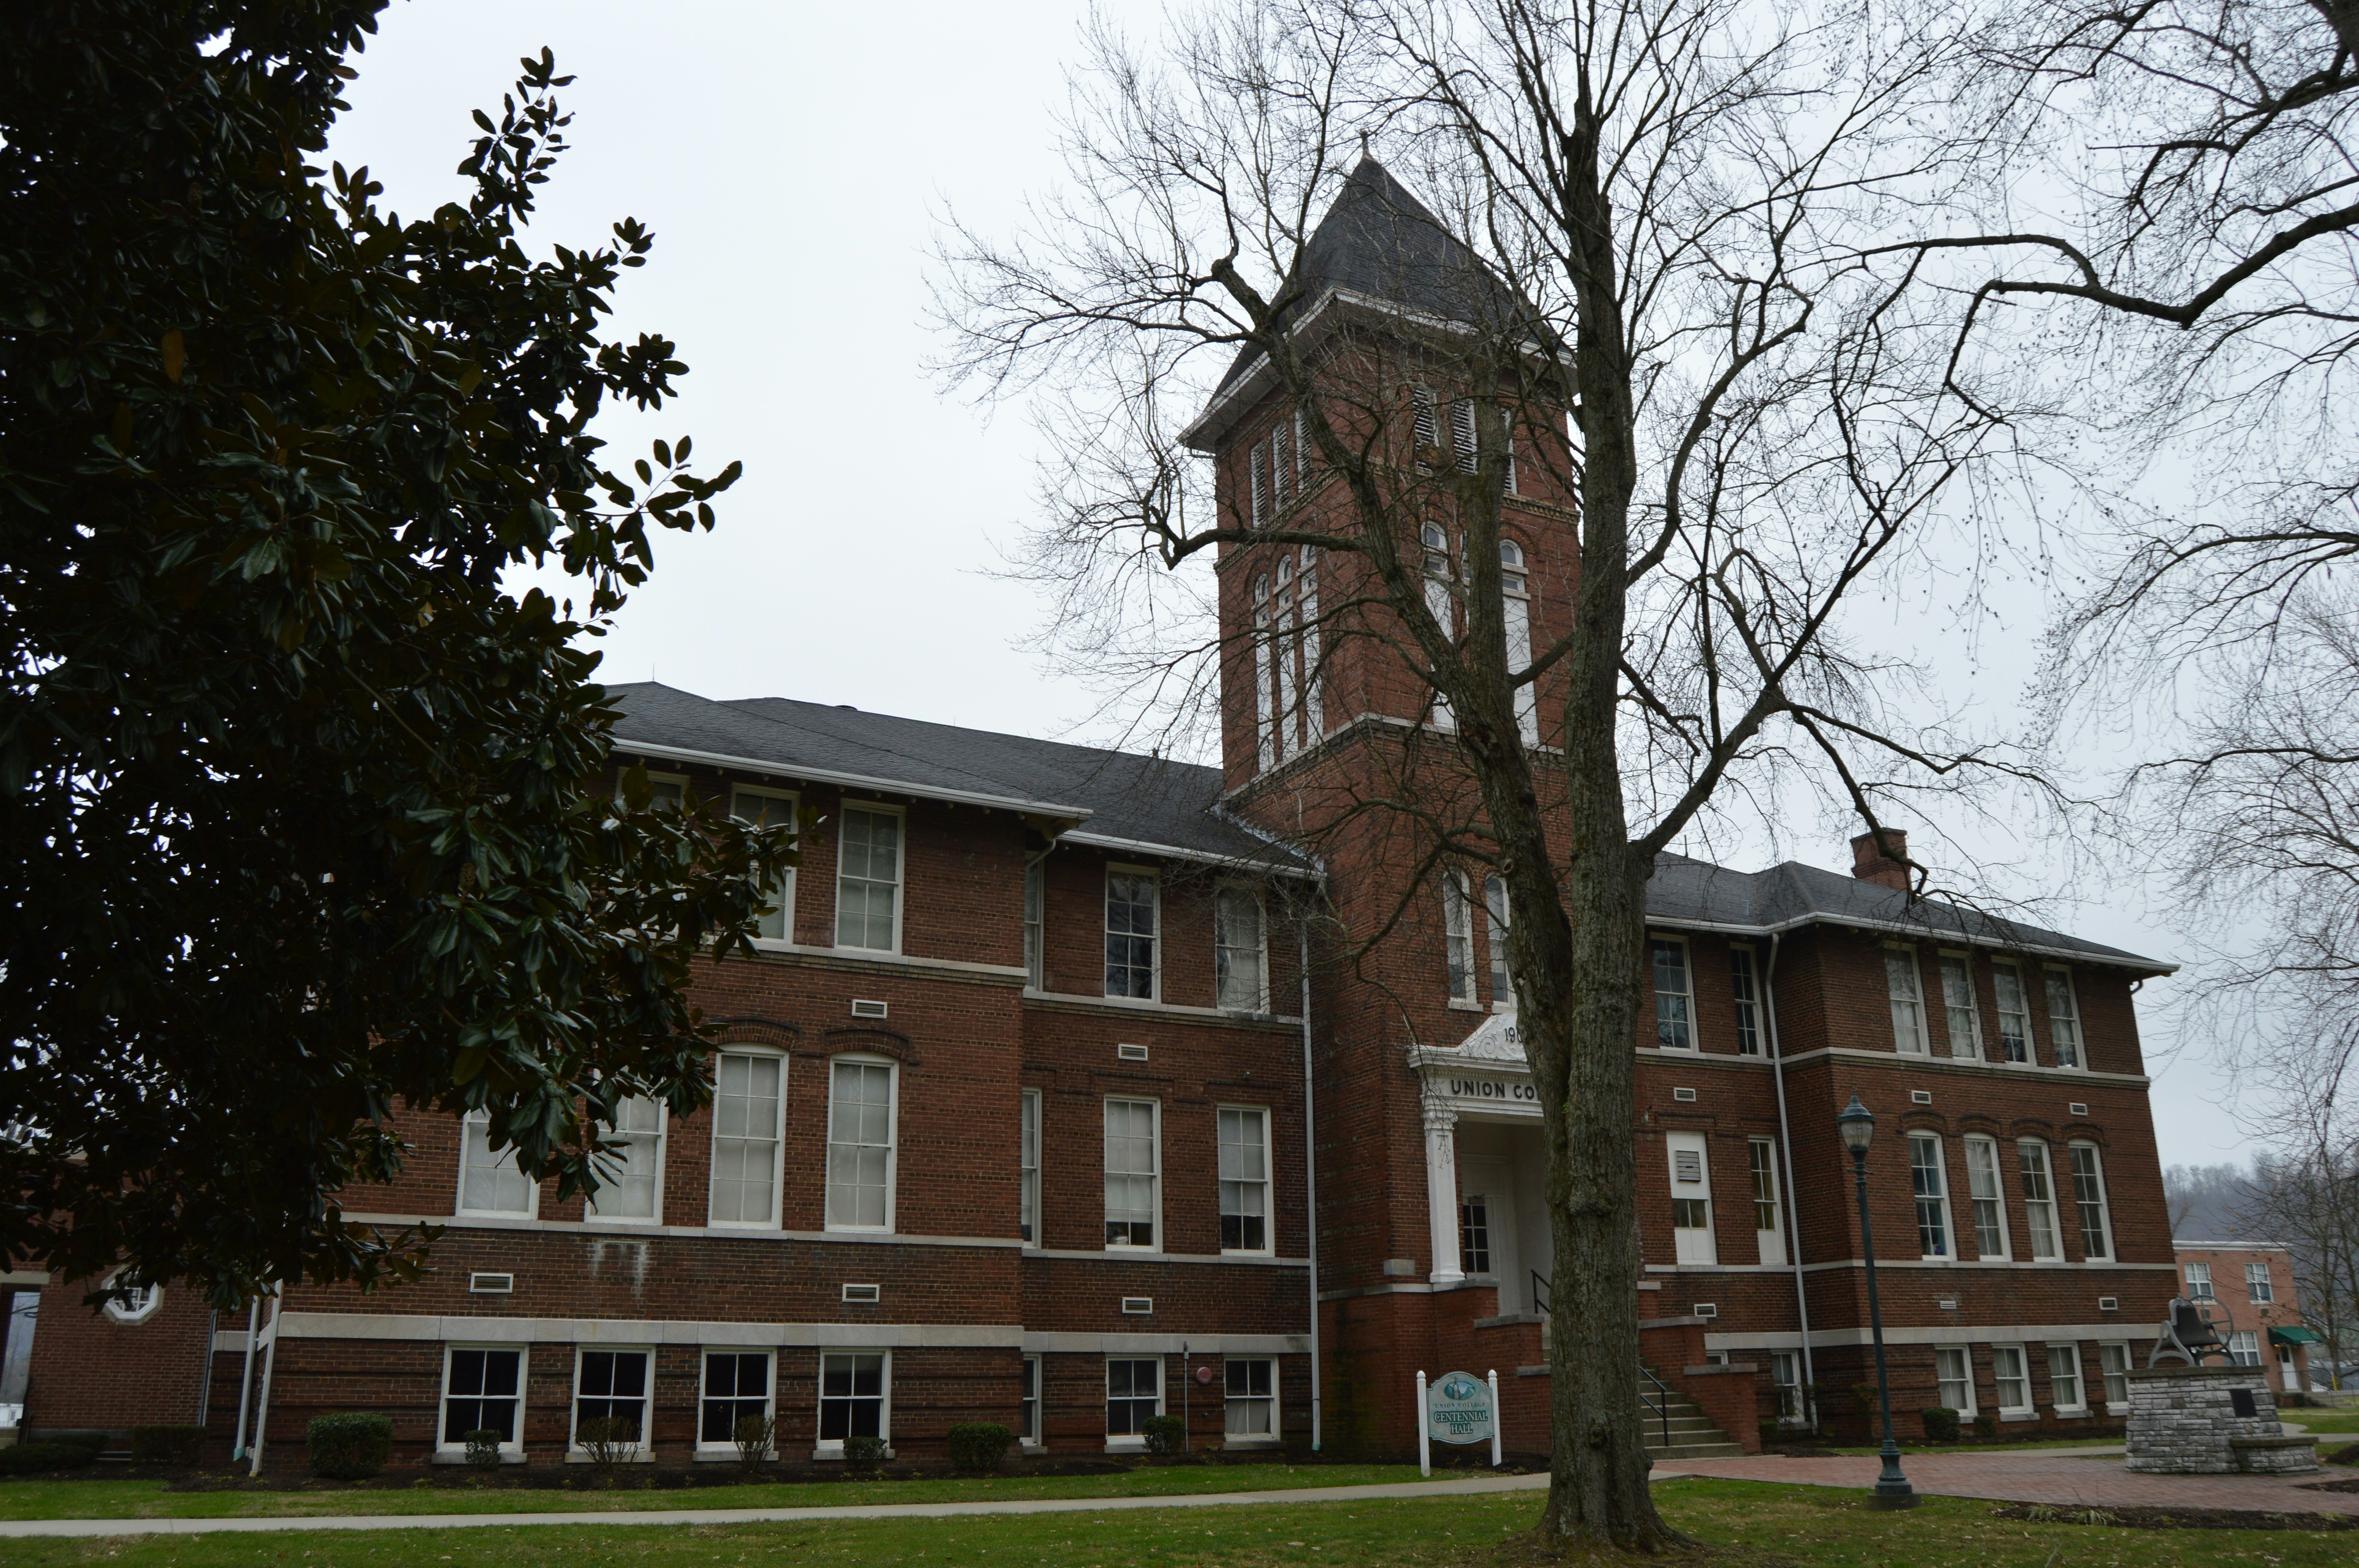
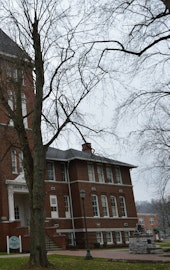
Union College (Kentucky)
Barbourville, Kentucky•Private
Your chances
—
Acceptance rate
56%
Private school in Kentucky with 700 total undergraduate students
Rural
Southeast
United Methodist
Mid-South Conference, Appalachian Athletic Conference
310 College St, Barbourville, KY 40906
(606) 546-4151
Loading…
Admissions
Overall acceptance rate
56%
Yield rate - overall
34%
Acceptance rate breakdown
Women
59%
Men
53%
Applicant breakdown
Total number of applicants
723
Women: 53%
Men: 47%
Cost & scholarships
Your estimated net cost
$ ? / year
In-state
$39,207
Out-of-state
$38,201
Published costs and averages can be misleading: they don’t fully account for your family’s finances (for financial aid) or your academic profile (for scholarships).
Want to see your personalized net cost after financial aid and scholarships?
Applications
How to apply
Doesn’t accept Common App
Test optional
Rec letters optional
Considers class rank
TOEFL required (international applicants)
Tests typically submitted
SAT: 6%
ACT: 84%
Policies can change. Please confirm by looking at this school’s website.
Students
First-year enrolled students (full-time)
200
Student diversity
Low diversity
4-year graduation rate
9%
6-year graduation rate
29%
Retention rate
64%
Admission policy
Co-ed
International students
6%
Enrolled breakdown by gender
Women: 42%
Men: 58%
Race & ethnicity diversity
Among domestic studentsAsian and Pacific Islander
1%
Black
13%
Hispanic
3%
Native American
< 1%
Other
5%
White
79%
Academics
Student faculty ratio
14:1
Calendar system
Semester
Special academic offering
Offers graduate degree
Where does this data come from?