Search a school
2,913 Colleges
Miami, FL
•
Private--Acceptance rate
--Avg GPA
--Cost
900Undergrads

New York, NY
•
Private22%Acceptance rate
--Avg GPA
$59KCost
1KUndergrads


Harlem, MT
•
Public--Acceptance rate
--Avg GPA
--Cost
Fewer than 200Undergrads
Abilene, TX
•
Private70%Acceptance rate
--Avg GPA
$52KCost
3KUndergrads
Tifton, GA
•
Public76%Acceptance rate
--Avg GPA
$18KCost
4KUndergrads

Bloomington, MN
•
Private--Acceptance rate
--Avg GPA
--Cost
Fewer than 200Undergrads

San Francisco, CA
•
Private--Acceptance rate
--Avg GPA
$47KCost
5KUndergrads
Alamosa, CO
•
Public100%Acceptance rate
--Avg GPA
$31KCost
2KUndergrads
Garden City, NY
•
Private78%Acceptance rate
3.63Avg GPA
$62KCost
5KUndergrads
Type to search...
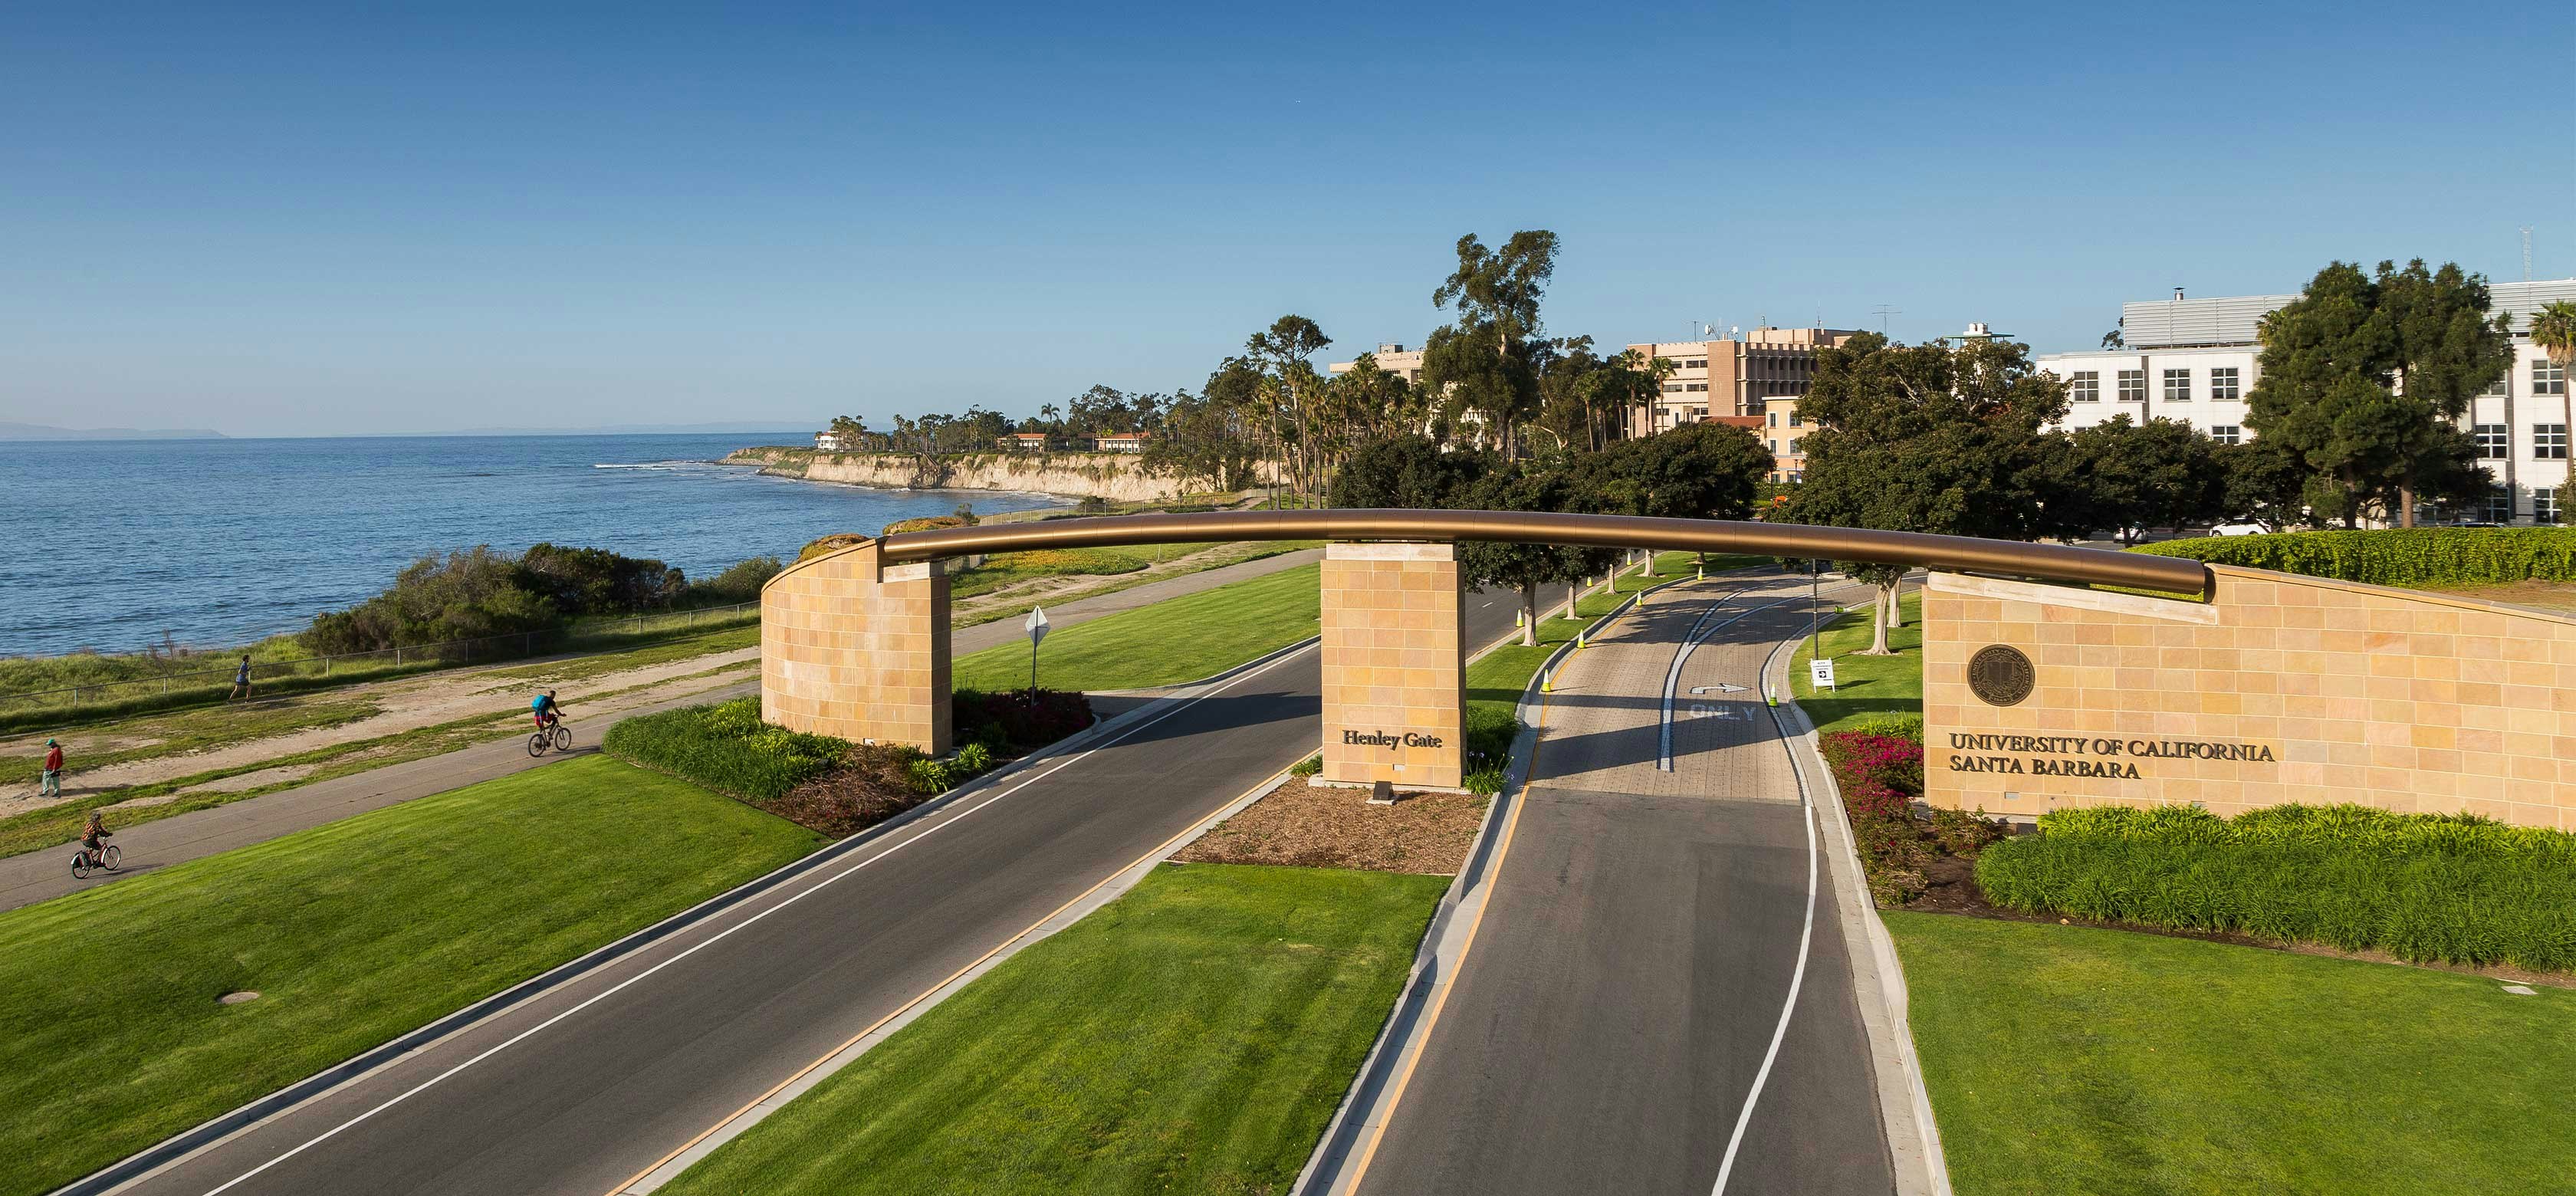
University of California, Santa Barbara | UCSB
Santa Barbara, California•Public
Your chances
—
Acceptance rate
29%
Public school in California with 23,400 total undergraduate students
Suburban
Far West
D1 Basketball
Big West Conference
5221 Cheadle Hall, Santa Barbara, CA 93106
(805) 893-8000
Chancing
What are your chances of acceptance?
Your chances
98%
Admissions
Overall acceptance rate
29%
Yield rate - overall
16%
Acceptance rate breakdown
Women
31%
Men
26%
Applicant breakdown
Total number of applicants
105,641
Women: 54%
Men: 46%
Cost & scholarships
Your estimated net cost
$ ? / year
In-state
$31,500
Out-of-state
$61,572
Average net cost after aid
Income
Average net cost
$0–30,000
$8,839
$30,001–48,000
$10,859
$48,001–75,000
$13,464
$75,001–110,000
$18,987
Over $110,000
$31,659
Published costs and averages can be misleading: they don’t fully account for your family’s finances (for financial aid) or your academic profile (for scholarships).
Want to see your personalized net cost after financial aid and scholarships?
Applications
How to apply
Doesn’t accept Common App
Test not used
Rec letters optional
Doesn’t consider class rank
TOEFL required (international applicants)
Policies can change. Please confirm by looking at this school’s website.
Students
First-year enrolled students (full-time)
4,900
Student diversity
Diverse
4-year graduation rate
69%
6-year graduation rate
83%
Retention rate
92%
Admission policy
Co-ed
International students
10%
Enrolled breakdown by gender
Women: 60%
Men: 40%
Race & ethnicity diversity
Among domestic studentsAsian and Pacific Islander
20%
Black
3%
Hispanic
29%
Native American
< 1%
Other
12%
White
35%
Academics
Student faculty ratio
22:1
Calendar system
Quarter
Special academic offering
Offers graduate degree
Where does this data come from?