Search a school
1 College
Ann Arbor, MI
•
Public20%Acceptance rate
3.84Avg GPA
$69KCost
33KUndergrads
Type to search

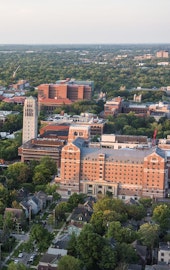
University of Michigan
Ann Arbor, Michigan•Public
Your chances
—
Acceptance rate
20%
Public school in Michigan with 32,600 total undergraduate students
Urban
Great Lakes
Medical school
On campus housing
D1 Football, D1 Basketball
Big Ten Conference
503 Thompson Street, Ann Arbor, MI 48109
(734) 764-1817
Loading…
Admissions
Overall acceptance rate
20%
Yield rate - overall
45%
Acceptance rate breakdown
Women
22%
Men
17%
Applicant breakdown
Total number of applicants
79,743
Women: 49%
Men: 51%
Cost & scholarships
Your estimated net cost
$ ? / year
In-state
$29,907
Out-of-state
$68,505
Average net cost after aid
Income
Average net cost
$0–30,000
$5,713
$30,001–48,000
$7,376
$48,001–75,000
$11,621
$75,001–110,000
$17,865
Over $110,000
$27,711
Published costs and averages can be misleading: they don’t fully account for your family’s finances (for financial aid) or your academic profile (for scholarships).
Want to see your personalized net cost after financial aid and scholarships?
Applications
How to apply
Accepts Common App
Test optional
Rec letters optional
Considers class rank
TOEFL required (international applicants)
Tests typically submitted
SAT: 64%
ACT: 48%
Policies can change. Please confirm by looking at this school’s website.
Students
First-year enrolled students (full-time)
7,290
Student diversity
Moderately diverse
4-year graduation rate
81%
6-year graduation rate
93%
Retention rate
97%
Admission policy
Co-ed
International students
8%
Enrolled breakdown by gender
Women: 55%
Men: 45%
Race & ethnicity diversity
Among domestic studentsAsian and Pacific Islander
15%
Black
5%
Hispanic
6%
Native American
< 1%
Other
9%
White
65%
Academics
Student faculty ratio
11:1
Calendar system
Trimester
Special academic offering
Study abroad
Credit for AP exams
Offers graduate degree
Academic and career counseling
Where does this data come from?