Search a school
1 College
Winona, MN
•
Public77%Acceptance rate
--Avg GPA
$27KCost
6KUndergrads
Type to search
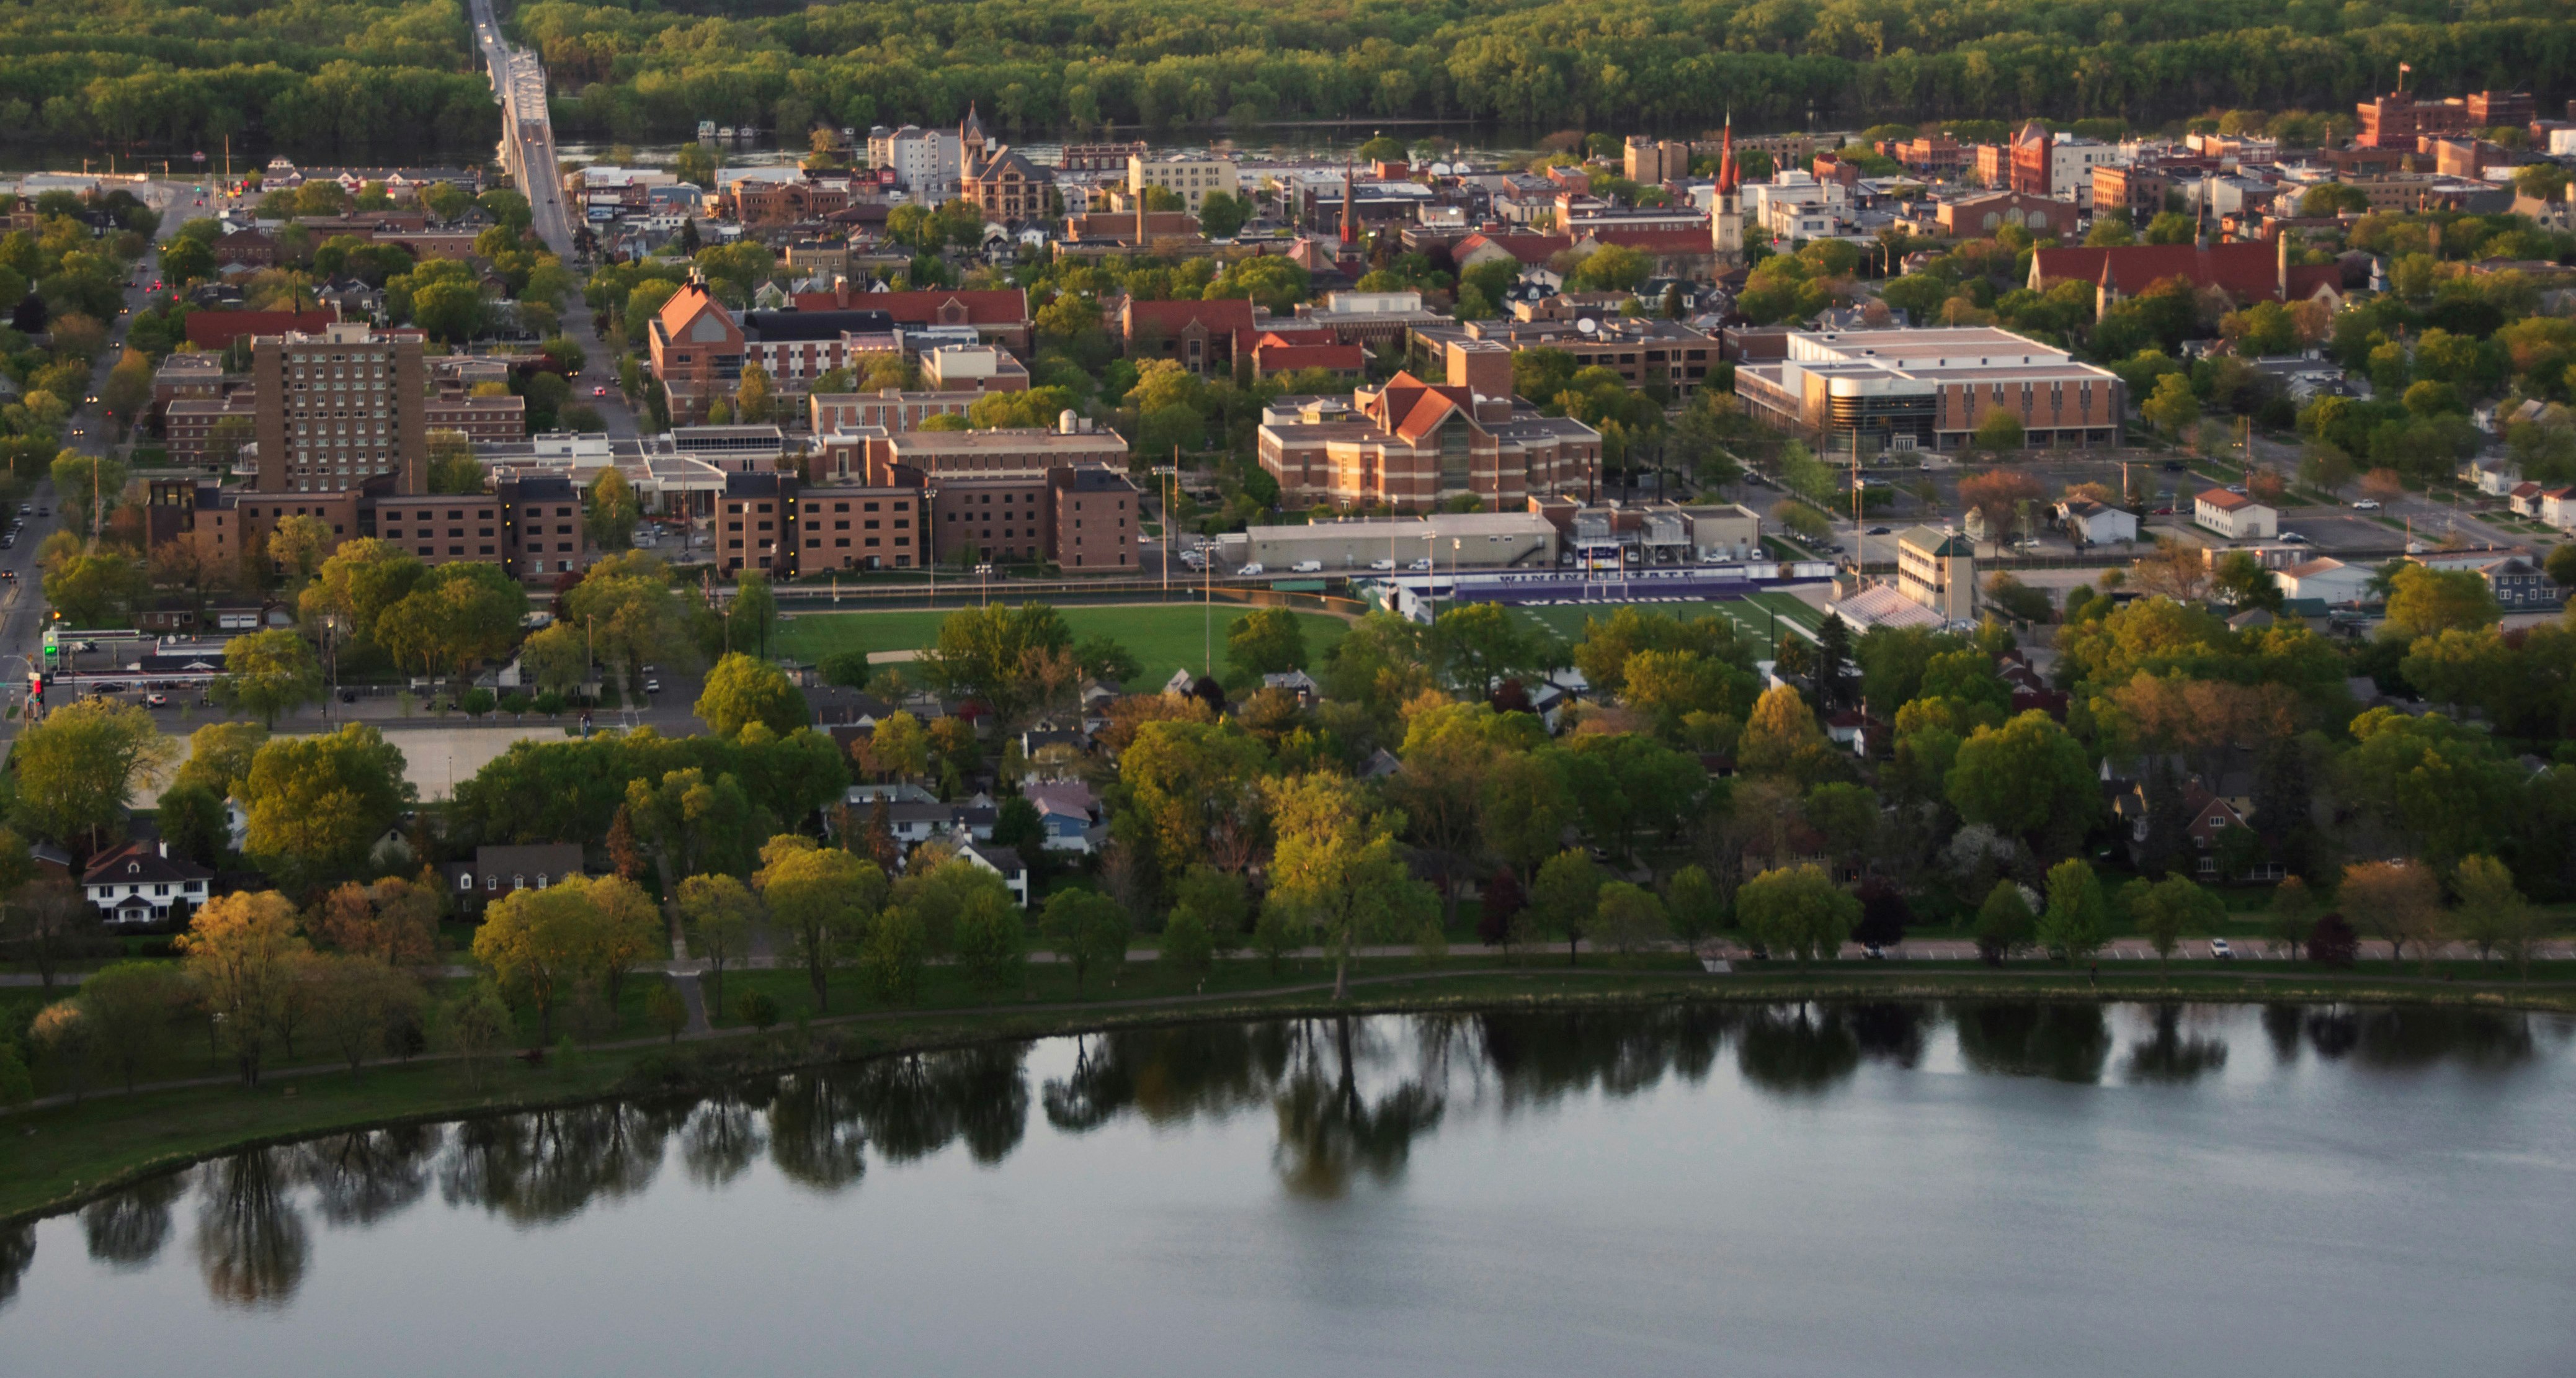
Winona State University
Winona, Minnesota•Public
Your chances
—
Acceptance rate
77%
Public school in Minnesota with 5,700 total undergraduate students
Rural
Plains
On campus housing
Northern Sun Intercollegiate Conference
175 West Mark Street, Winona, MN 55987
(507) 457-5000
Loading…
Admissions
Overall acceptance rate
77%
Yield rate - overall
27%
Acceptance rate breakdown
Women
78%
Men
72%
Applicant breakdown
Total number of applicants
5,335
Women: 70%
Men: 30%
Cost & scholarships
Your estimated net cost
$ ? / year
In-state
$20,146
Out-of-state
$26,878
Average net cost after aid
Income
Average net cost
$0–30,000
$12,051
$30,001–48,000
$12,522
$48,001–75,000
$15,212
$75,001–110,000
$18,615
Over $110,000
$20,862
Published costs and averages can be misleading: they don’t fully account for your family’s finances (for financial aid) or your academic profile (for scholarships).
Want to see your personalized net cost after financial aid and scholarships?
Applications
How to apply
Doesn’t accept Common App
Test optional
Rec letters optional
Doesn’t consider class rank
TOEFL not used (international applicants)
Tests typically submitted
SAT: 2%
ACT: 67%
Policies can change. Please confirm by looking at this school’s website.
Students
First-year enrolled students (full-time)
1,098
Student diversity
Very low diversity
4-year graduation rate
41%
6-year graduation rate
58%
Retention rate
78%
Admission policy
Co-ed
International students
3%
Enrolled breakdown by gender
Women: 70%
Men: 30%
Race & ethnicity diversity
Among domestic studentsAsian and Pacific Islander
3%
Black
3%
Hispanic
3%
Native American
< 1%
Other
4%
White
87%
Academics
Student faculty ratio
18:1
Calendar system
Semester
Special academic offering
Study abroad
Credit for AP exams
Offers graduate degree
Where does this data come from?